IT Healthcheck
Full-stack infrastructure monitoring built for on-premise environments.
One service. Every check type. Complete visibility.
Built for On-Premise IT Teams
No cloud dependency. No per-host licensing. No agent deployment.
Infrastructure & Ops Teams
A single pane of glass across your entire on-premise stack — hardware, VMs, storage, and services — without needing multiple tools or cloud agents.
Managed Service Providers
Run one self-hosted instance per customer or share a single deployment across multiple environments. Role-based access keeps teams scoped to their own hosts.
Security-Conscious Environments
All credentials encrypted at rest. No data leaves your network. Runs entirely within your own infrastructure — ideal for air-gapped or compliance-sensitive environments.
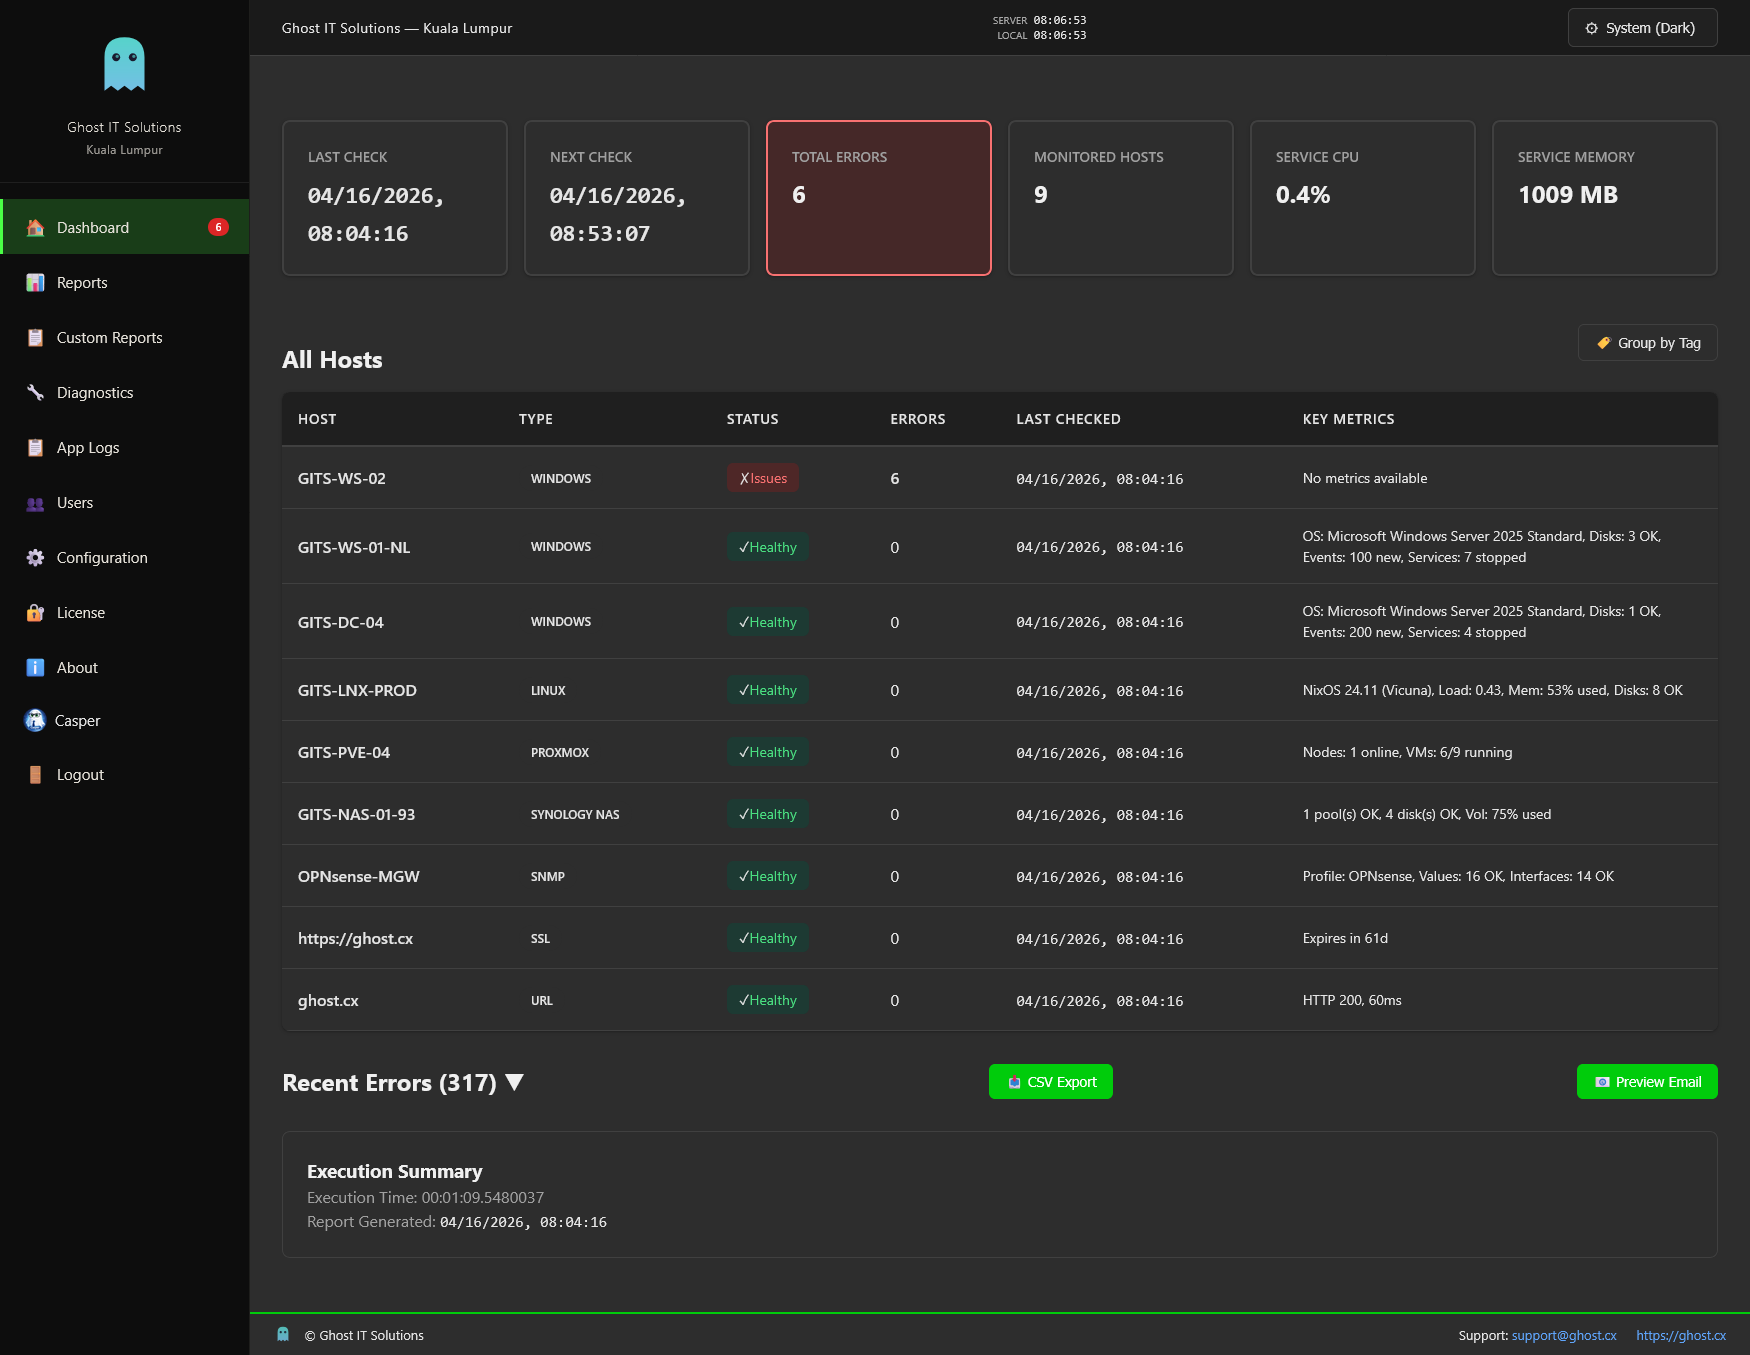
See It in Action
The live dashboard updates in real time as checks complete — no page refreshes required.
What IT Healthcheck Monitors
From bare-metal hardware to hypervisors, databases, and application endpoints — a single pane of glass for your on-premise stack.
Built for Production Environments
Every feature designed around real on-premise infrastructure challenges.
Hardware & Compute
Redfish Hardware Health
Polls HPE iLO and Dell iDRAC via the standard Redfish API to surface fan speeds, PSU status, temperatures, BIOS events, storage controller state, and physical drive health across your entire server fleet.
Hypervisor Monitoring
Monitors Hyper-V (VM state, snapshots via WinRM), VMware ESXi/vCenter (VMs, datastores, stale snapshots via REST API), and Proxmox VE (nodes, VMs, containers, storage pools, backup tasks via API token). Stale snapshot detection and datastore usage alerts included.
Windows Host Monitoring
Executes PowerShell over WinRM to check CPU load, memory pressure, disk utilisation, Windows services, event log errors, and pending reboots — no agent required. Detects Intel RST RAID and NVMe health. Optionally checks server roles: DHCP scope utilisation, IIS app pool health, WSUS, data deduplication, FSRM quotas, and Active Directory replication. Tracks pending Windows updates against an offline catalog so monitored hosts need no internet access.
Linux Host Monitoring
Connects over SSH using password or private-key authentication. Checks OS details, disk usage per mount, memory pressure, and systemd service states — no agent required. When Docker is present, lists all containers with CPU %, memory, network I/O, and port bindings, with start/stop/restart controls directly from the dashboard. Per-mountpoint disk threshold overrides and available package update detection are also supported.
SQL Server Health
Checks Microsoft SQL Server connectivity and database availability using SQL authentication or Windows Integrated Security. Supports credential impersonation so the monitoring service does not need to run as a privileged domain account. For high-availability environments, optionally monitors Always On Availability Groups — reporting per-AG sync health, replica roles, connected/operational state, and log send/redo queue sizes.
SNMP Polling
Queries any SNMP v1/v2c/v3 device — switches, environmental sensors, and more — using configurable OIDs with threshold-based alerting. APC UPS units have a dedicated profile that surfaces battery charge, estimated runtime, load percentage, temperature, and battery replacement indicators without manual OID configuration.
Firewall Monitoring
Dedicated REST API integrations for OPNsense and SonicWall firewalls. OPNsense checks cover system resources, gateway up/down state, firmware availability, temperature sensors, IDS/Suricata, Unbound DNS, OpenVPN, IPsec, WireGuard peer handshake staleness, HAProxy, and DHCP pool utilisation. SonicWall covers interfaces, IPsec and SSL-VPN tunnels, security licence expiry, and system resources — no SNMP required.
Storage & Web
MSA Storage Arrays
Connects to HPE MSA storage controllers to check disk group health, virtual disk status, port states, and controller events.
Synology NAS
Queries the Synology DSM API to surface disk health and S.M.A.R.T. status, volume and storage pool state, SSD cache health, system temperature, and firmware update availability. Optional Active Backup for Business task monitoring included.
SSL Certificate Tracking
Tracks expiry dates and validates certificate chains for every monitored host. Alerts before certificates expire so you never get caught off-guard.
URL & Endpoint Checks
Verifies HTTP/HTTPS endpoints respond within expected time with expected status codes. Ideal for monitoring APIs, portals, and public-facing services.
Connectivity & Network Checks
Combines three complementary network checks in one: ICMP ping with min/avg/max latency and packet-loss thresholds; TCP port reachability with connect-time measurement; and TTL-based traceroute with configurable max-hop limits. Separately, NTP drift checks connect to remote Windows hosts via WinRM and report clock offset with configurable warn/error thresholds, while DNS resolution checks verify that configured FQDNs resolve correctly from the perspective of the monitored host.
Alerting & Operations
Smart Email Alerts
Sends rich HTML alert emails via MailKit when thresholds are breached or hosts go offline. Configurable per-group recipients and escalation rules.
Webhook Notifications
Fires HTTP webhooks on state changes and recovery. Natively formats rich embeds for Microsoft Teams, Slack, and Discord (including Discord's colour bar, field grid, and title link). Any generic HTTP endpoint works too — PagerDuty, custom automation, and more. For servers without direct outbound internet access, a browser-relay option routes the POST through the user's open browser tab instead.
Alert Acknowledgement
Operators can acknowledge an active alert to silence repeat notifications until the condition clears or resurfaces. Prevents alert fatigue without losing visibility — the dashboard still shows the acknowledged state.
Maintenance Windows
Schedule recurring maintenance windows per host or group. Alerts are automatically suppressed during the window so overnight patching and planned downtime do not generate noise.
Browser Notifications
Native OS push notifications delivered directly to the browser when checks detect errors or a recovery. State-change gating ensures the browser is only notified when status actually changes, not on every repeated error cycle. An optional synthesised beep (Web Audio API — no audio file required) can accompany each notification. The browser tab title also updates after each check run to show the current error count, so the count is visible even when the tab is in the background.
Alert Rules
Define custom per-host alert rules that fire notifications beyond the built-in threshold system — for example, targeting specific host types, tags, or error conditions with their own recipient lists and escalation behaviour. Rules are evaluated after every health-check cycle and compose cleanly with maintenance windows and acknowledgements.
Visibility & Reporting
Real-time Dashboard
A live Blazor Server dashboard pushed over SignalR — no polling, no page refreshes. See the status of your entire infrastructure at a glance.
Historical Reports
Browse and filter past healthcheck results to identify recurring issues, track trends over time, and build evidence for infrastructure decisions.
Custom Reports
Define named report templates that include only the sections relevant to a specific audience — operations, management, or auditors. Each report can be scoped to a subset of check types so recipients see exactly what they need.
Application & Software Tracking
Monitors installed application versions on Windows hosts by querying the registry — no agent required. Raises a one-time alert whenever a version changes, making it easy to spot unplanned upgrades, rollbacks, or software that has drifted between hosts. Version history and previous-version comparisons are shown on the host detail page and included in HTML reports.
Access & Connectivity
Authentication & Access
Three-tier access model (Admin, Operator, Viewer) with multiple login options to fit any environment. Local accounts support TOTP two-factor authentication and hardware security keys / passkeys via FIDO2 / WebAuthn. OIDC/SSO integration lets users sign in through any standards-compliant identity provider — Entra ID, Keycloak, Okta, and others — with group claims mapped to app roles. LDAP / Active Directory authentication is also available for air-gapped environments, supporting plain LDAP, LDAPS, and STARTTLS with group-to-role mapping.
SSH Tunnel Support
Establishes on-demand SSH tunnels to reach iLO, WinRM, and MSA endpoints that sit behind network boundaries — no VPN required on the monitoring host.
How It Works
Simple to deploy, powerful in practice.
Configure Your Hosts
Add servers, network devices, and services through the built-in web UI. Set your preferred check interval, configure credentials, and assign hosts to groups. All credentials are encrypted at rest using ASP.NET Data Protection — no plaintext secrets in config files.
Automated Health Checks
On your configured schedule, the orchestrator runs all check types in parallel across every configured host — hardware, hypervisors, services, databases, storage, networking, and web endpoints — with no manual intervention required.
Instant Alerts
When a threshold is breached or a host goes offline, alerts fire immediately via email and/or webhook. Acknowledge alerts to suppress repeat notifications, or schedule maintenance windows to silence them automatically during planned downtime.
Investigate & Report
The real-time dashboard and historical reports give you the context to investigate issues quickly and build a reliable picture of infrastructure health over time.
Integrations & Deployment
Fits into your existing workflow without friction.
Teams, Slack & Discord
Webhook payloads formatted natively for Microsoft Teams, Slack, and Discord (rich embeds with colour bar and field grid). Any generic HTTP endpoint works too.
SMTP Email
Outbound alerts via any SMTP relay — Office 365, Gmail, or self-hosted. TLS and OAuth2 supported.
SOCKS5 Proxies
Route checks through SOCKS5 proxies for segmented networks. Per-host proxy assignment with optional authentication.
Windows Service
Runs as a native Windows Service or as a standalone console process. No external dependencies beyond .NET runtime.